


Thomas A. Lang and Michelle Secic said in their book entitled How to Report Statistics in Medicine that “The problem of statistical errors in the medical literature is long-standing, wide-spread, potentially serious, relatively unknown, and not well addressed, despite the fact that most errors occur in the more common applications of statistics.”This blog will help readers develop an understanding of statistical summaries and understand its use when analyzing results.
The Statistical summaries help to minimize the amount of text needed and to make findings more understandable. There are several methods of presenting statistical summaries, but the challenge is to identify the appropriate one. To identify correct method you must have a good understanding of data. A concise Flow-Chart is given to help you identify an appropriate method as per the nature of the data
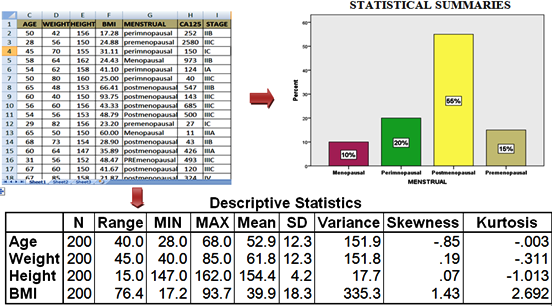
. Statistical tables are used to organize different groups’ numerical data, such as patients’ ages, gender, baseline characteristics, and follow-up measurements. Similarly, a graph or figure is used to graphically plot your data as differences in effects between different subject groups.Five Ws (Why, Who, What, When, Where) must be understood for any measurement. For example, smoking status can be measured in various ways. Was it measured as smoker or non-smoker; Or as ex-smoker, non-smoker, current-smoker, ever-smoker; Or as no. of cigarettes smoke a day? Once you understood how the variables were measured, you must check whether the measurement is appropriate for the study through other Four Ws.
In common practice, continuous data, such as age, are often grouped into categories, such as <30, 30 – 60, and >60. This practice reduces the precision and variability of the data which generally, is not taking into account during analysis. It is a myth that mean (with standard deviation) is the standard way of representing summary, as it describes the center (and variability) of a normal distribution; however, it is the most critical measure to be used with precaution as it gets affected by the extreme observations. In such cases, median (with IQR) is the best measure presenting summary for non-normal data. Check the distribution of data before summarizing it.
Another myth is using standard error of mean (SEM) instead of SD. SEM is always lesser than the SD, so it is often reported in place of SD to show the variable more precise. SEM is a measure of precision of an estimate (±1 SEM shows 68% confidence interval) however the preferred measure of precision in medicine is the 95% confidence interval (CI). Simply, we may say, mean±SD is the preferred summary for normally distributed data, and the mean and 95% CI are preferred for an estimate and its measure of precision.
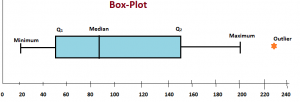 Box-plot and histograms are the other ways to show normality of the data. Box-plot is the most commonly used plot among researcher because it presents five summaries at a time.
Statistical summaries can be presented by three main methods:
- Measures of Location: It tells you where your data is centered at, or where a trend lies. Example: Mean, Median, Mode, Quartiles, Geometric Mean
- Measures of Spread: It tells you about spread or variability in your dataset. Example: Range, SD, IQR, SEM, 95%CI
- Graphs/Charts/Diagrams: It presents a complete picture of your data. Example: Bar and Pie Chart, Frequency & Contingency Tables, Histogram, Box-plot, Scatter Diagram.
It is suggested that systematic pattern should be followed by researchers in presenting their studies data to improve quality of research. In my next blog, I will be discussing sample size.
Disclaimer: The picture used in this blog is for education purpose only with no commercial usage.
Last modified: 21/11/2019