


Data graphics are the combinations of data points, lines, numbers, a coordinate system, symbols, words, shading and colours. Graphs are the instruments for reasoning about quantitative information and the most powerful tool communicating statistical inference. Modern graphics can do much more than simply substitute for small statistical tables.
Edward Tufte gave some principles of graphical integrity and excellence:
- Representation of numbers should match the true proportions.
- Labeling should be clear and detailed.
- Show data variation not design variation.
- The number of dimensions represented should be the same as the number of dimensions in the data.
- Representations should not imply unplanned context.
- Use words, numbers and drawing together.
- Often have a story to tell about your data.
- Content-free decoration should be avoided including chartjunk.
- The number of variable dimensions portrayed should not exceed the number of dimensions in the data.
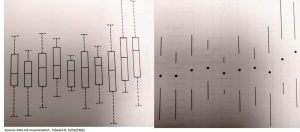
- Erase non-data-ink, within reason. Ink that fails to show statistical information does not have much interest to the viewer. Bilateral summary of data measures also creates redundancy as in box plot and open bar.
For example, box-plot can be redesigned (refer the following figure) without loss of information.
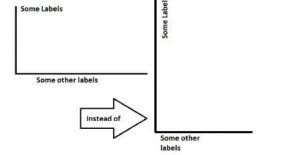
Graphics should tend towards the horizontal, greater in length than height. Our eye is naturally practised in seeing deviations from the horizon. It is also easier to write and read words from left to right.
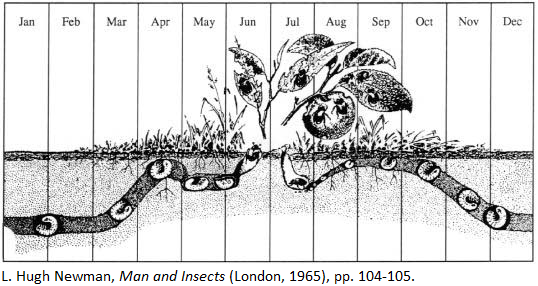
Histograms are already been replaced by the box-and-whisker-plots. Box plots have an advantage over histogram as it gives five number summaries. Similarly, representation of data in every field has changed and shown in following pictures.
The excellent graph is one, which consists of complex ideas communicated with precision, efficiency and clarity in the shortest time.
Last modified: 21/11/2019